HotStats Blog
Tracking the evolution of key performance indicators (KPIs) over time allows hoteliers to identify meaningful trends, create forecasts and budgets and assess the results of different strategies. To perform this kind of analysis, data has to be recorded within consistent time intervals and in chronological order. This is known as a time series.
For example, daily occupancy for the past month is a time series: data (occupancy) is recorded within a consistent time interval (daily) and is chronologically displayed. There are many ways of looking at a time series, depending on the kind of insights you want to extract from it. In this article, we’ll discuss the two most commonly used methods: seasonal and moving average.
Seasonal Method
Hospitality industry data is volatile: high, shoulder and low seasons cause dramatic fluctuation from one period to the next. The seasonal method explores these short-term variations in order to understand the trends that are repeated systematically. We’ll use HotStats data to illustrate this. The seasonal graph below shows monthly RevPAR data for the U.S. from January 2016 to August 2019.
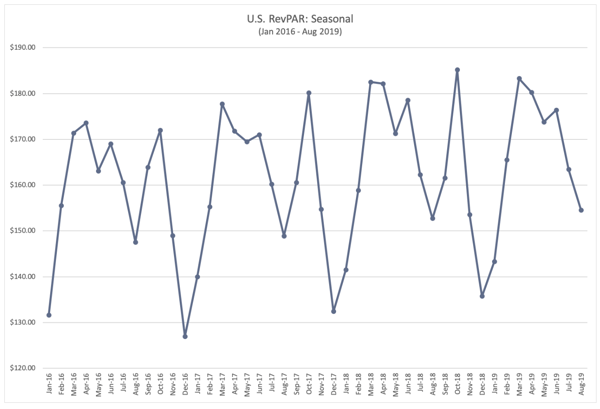
This graph clearly shows the systematic repetition of a pattern characterized by peaks in March, April and October, and marked declines in January, February, July, August, September, November and December, with May and June acting as a shoulder. This is very helpful when creating a budget and forecasting monthly activity. It’s also a quick check for anomalies because it makes it easy to spot outliers that move away from the pattern and require explanation.
From a benchmarking perspective, you could also plot your competitive set’s seasonal results on the same graph and check if the patterns match to have a better understanding of the business landscape. Furthermore, patterns can change over time: Maybe a new attraction is driving business to an area in months that were formerly quiet. Seasonal graphs are exceptional tools for spotting these changes.
Seasonal data, however, has its limitations: The volatility makes it hard to identify long-term trends. If you want to understand whether U.S. monthly RevPAR has been growing or decreasing from January 2016 to August 2019, the graph above will not be much help. With its peaks and valleys, finding a trend line is not straightforward. It’s precisely why hoteliers turn to moving averages to smooth the data.

Moving Average Method
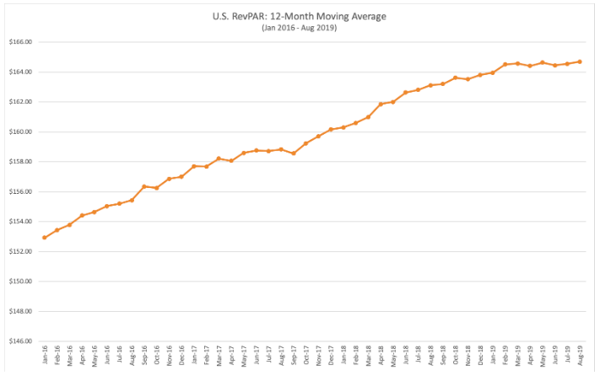
The moving average method does away with the short-term variations in order to find the non-systematic changes in the data—in other words, increases or decreases that are not explained by moving from one business season to another. This is achieved by using averages instead of actual results for each time period. Thus, the weight of historical data smooths over any specific short-term change.
To calculate each data point, you need to decide how many months of historical data you want to include in your averages. Using HotStats data, the graph below depicts the 12-month moving average of monthly U.S. RevPAR from January 2016 to August 2019.
 Each data point is calculated as the simple average of 12 consecutive months. So, for each period we have:
- 12-month Moving Average January 2016 = Sum of RevPAR from February 2015 through January 2016/12
- 12-month Moving Average February 2016 = Sum of RevPAR from March 2015 through February 2016/12
- 12-month Moving Average August 2019 = Sum of RevPAR from September 2018 through August 2019/12
The variations from the seasonal graph are imperceptible in the 12-month moving average graph, and we can now identify a clearly growing trend in U.S. RevPAR for most of the analyzed period. Also of note: This upward trend has plateaued since February 2019. This deceleration of RevPAR can have serious implications for profitability and should drive hoteliers to integrate deeper analysis into their expenses to enhance flow-through.
Conclusion
There is no single way to look at data. Each method yields unique insights and it’s important to understand when and how they should be used. Today, benchmarking platforms such as HotStats have the ability to present financial data in different formats to help hoteliers make more informed decisions that will ultimately drive the bottom line.