

 Resource Center
As Peter Drucker once wrote, “what gets measured gets managed”. However, data by itself offers limited aid for the evaluation and decision-making processes that every business strategy needs. The depth of analysis performed on the available data is therefore the key to identifying the issues that a company faces, and the necessary steps to overcome them. The quality of the analysis of “what gets measured” will then define the success of the action plans designed to “get it managed”. In this post and the next we will describe the two most widely known methods to analyze financial data - horizontal and vertical analysis – and provide examples to clarify their uses and calculations.
Horizontal Analysis
Horizontal analysis (also known as “trend analysis”) describes the changes in a measure over time. It is crucial for the integrity of the conclusions that the chosen time periods are comparable. What we mean by this is that there should be a coherence between the intervals that are to be analyzed. Examples of comparable time periods are: the current financial year vs the previous financial year, the current month vs the previous month, the current month vs the same month last year. On the other hand, incomparable ones would be: the current month vs the current financial year, the current financial year vs December last year, the current month vs the previous quarter. If we are not careful about choosing the intervals, the analysis will yield spurious results. The second necessary condition for horizontal analysis is that the measure chosen is the same across the time periods. For example, GOPPAR of the current financial year vs GOPPAR of the previous financial year would be a feasible comparison, but GOPPAR of the current financial year vs RevPAR of the previous financial year would make no sense.
Once we have checked that the two conditions (comparability of time periods and measures) are met, calculations are very straightforward. For the sake of simplicity, we will call our measure X, and denote the time periods by numbers: 2 for the current and 1 for the previous (or base) one. Therefore, X2 will be our measure in the current period, and X1 will be the base measure.
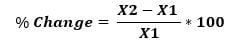
The first step, is to compute the difference between the current measure and the base: X2-X1. This will show us how much X changed from one period to the other. Note that you should always subtract the base from the current measure and not the other way around. What we want to do next is to understand how that change compares to the measure in period 1. In mathematical terms, we need to divide the difference we just computed by the base measure: (X2 - X1)/X1. Finally, because our goal is to identify the percentage change in X, we must multiply by 100. Therefore, the complete formula is:
Let’s use an example:
You are the CFO of the Illustration Hotel. Your accounting team has prepared the P&L statement for the year 2018, and you want to assess how the current performance compares to that of 2017.
First, you look at Rooms Revenue. In 2018, the hotel recorded $12,088,510 in this measure, while in 2017, it generated $12,074,970. What’s the percentage change?
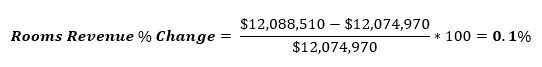
Table 1 summarizes the percentage changes for all the items in the summary operating report, calculated with the same formula:
Table 1. Summary Operating Statement
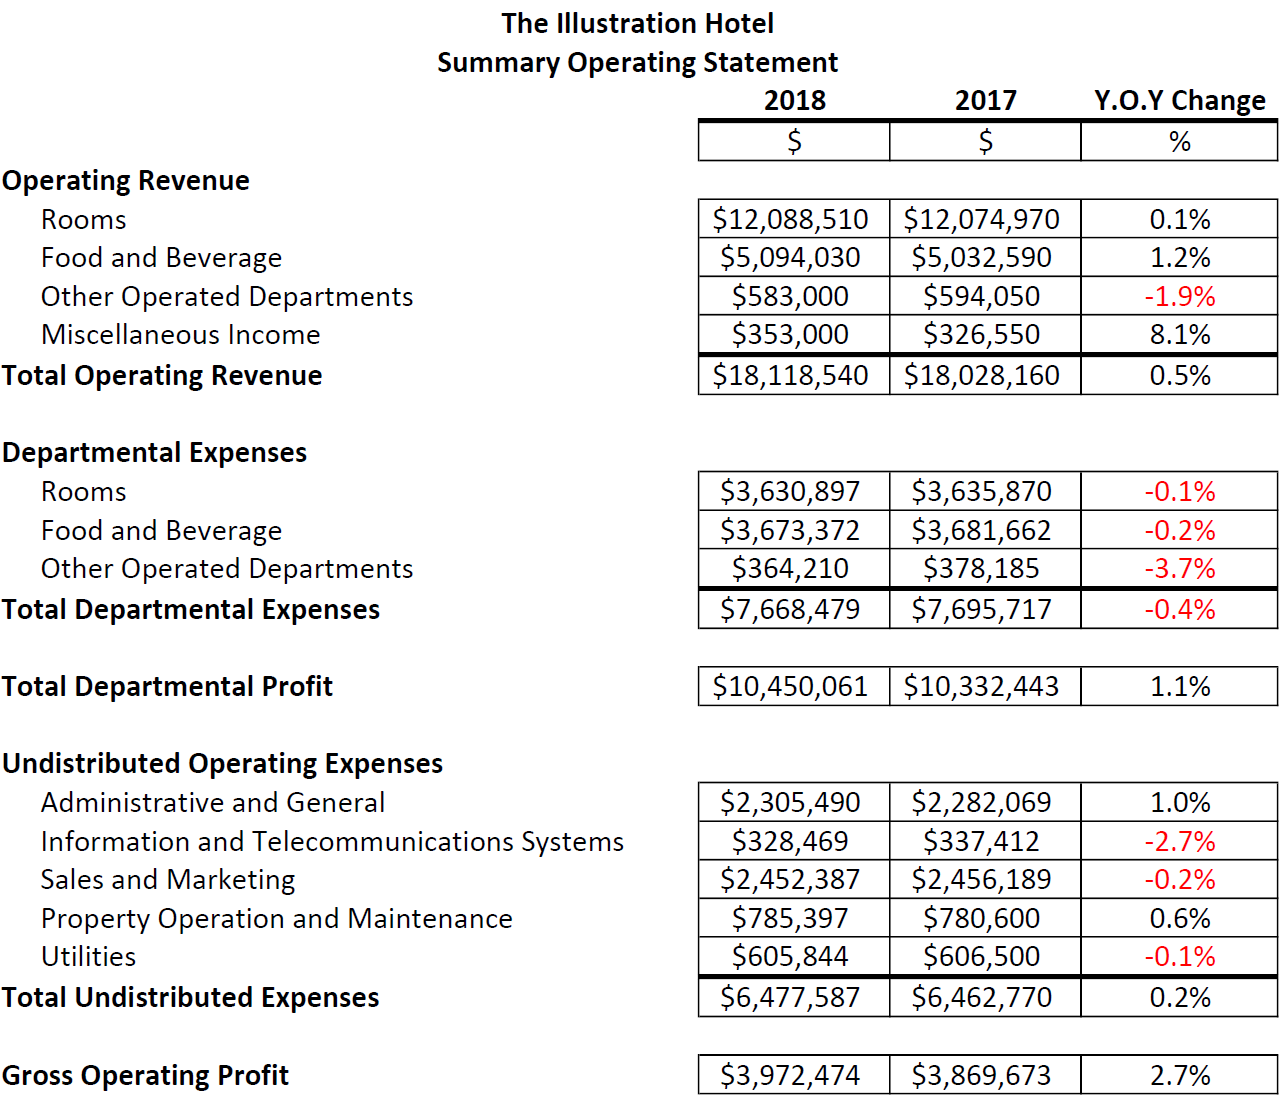
From the horizontal analysis, you can be quite optimistic about the 2018 performance. The operation seems to have become more efficient, with all revenues increasing, except for Other Operated Departments, and all departmental expenses on the fall. Undistributed expenses show more mixed results, albeit the total has remained nearly stable. Of course, you will want to take a more detailed look at the revenues of Other Operated Departments, and A&G and P&M expenses, to understand why they show results that differ from the trend. But all in all, GOP shows a healthy 2.7 percent increase.
However, horizontal analysis allows you to not only identify the trends in your own property, but also compare them to your competitors’ to better assess your operation’s standing in the market. So, after calculating the Y.O.Y % changes for the Illustration Hotel, you decide to compare the results with the averages of your competitive set. Table 2 shows the Y.O.Y. % changes side by side:
Table 2. Y.O.Y. % Changes, The Illustration Hotel and Competitive Set Average
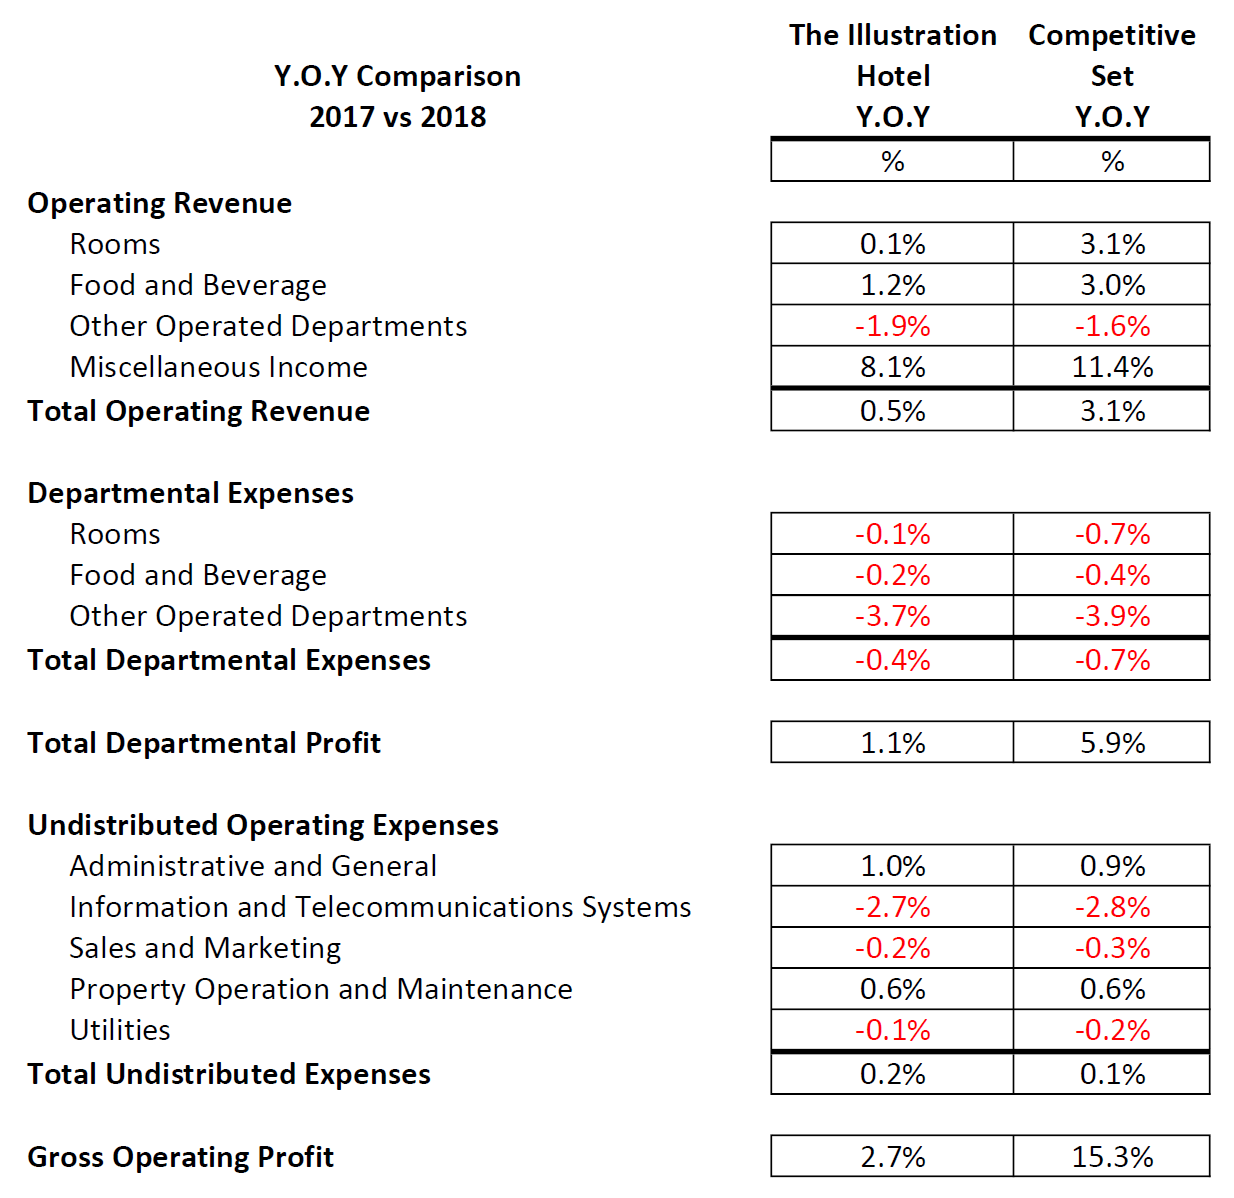
This comparison might affect conclusions a little bit. Even though the Illustration Hotel’s Operating Revenue shows an upward trend, it is not nearly as positive as its competitors’ average. Expenses seem to be more aligned with the set’s trend, but with revenues lagging far behind the average, this isn’t very good news either. In the end, compared to your competitors’ 15.3 percent increase, your humble 2.7 percent gain in GOP leaves a bitter aftertaste.
As you can see, horizontal analysis is a tool that helps you understand the data so that you can ask yourself relevant strategic questions about your operation. It does not provide any solutions, but rather acts as a guide for thought and decision-making.
Percentage point change vs Percentage change
Our final comment about performing a horizontal analysis deals with the difference between a percentage change and a percentage point change. This key distinction is oftentimes ignored, which leads to confusion when trying to interpret metrics that are expressed in percentage units across time. Occupancy is one of these metrics, so let’s use it as an example to clarify the issue.
The Illustration Hotel achieved a 76% occupancy in 2018. If in 2017 it was 69%, we know that the hotel is doing better – but how much better? There are two ways to answer this question: calculating the percentage point change and calculating the percentage change.
A percentage point change indicates the arithmetic difference between two percentages, and it is calculated simply by subtracting the base percentage from the current one. In our example:

A percent change, as we have seen, compares the difference over time in the metric to its original value. So, the occupancy percentage change should be calculated as follows:
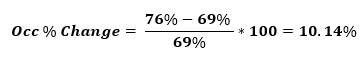
Therefore, we can say that in 2018 the Illustration Hotel increased its occupancy by 7 percentage points or that occupancy grew by 10.14%. And both statements are correct! The caveat is that while the percentage point calculation focuses on the difference in the percentage magnitudes (occupancy), the percent change shows the difference in the underlying measure (rooms sold). They are just two ways of saying the same thing.