

 Resource Center
In Data Analysis Part 1, we covered why horizontal analysis is a critical tool for every manager. Not only does it help identify trends over time, but it also allows us to compare these trends to a competitive set with the purpose of finding key issues within our own operation. In this post we will go over a different approach to data: vertical analysis. The objective is to define the concept and calculation, as well as understand its uses and differences with horizontal analysis.
Vertical Analysis
Vertical analysis (often referred to as “common-size” analysis) looks at the composition of the operation at a single point in time, comparing each measure against a base. You can think of this analysis as a snapshot of the operation that shows every measure as a percentage of the base. Because of this, the analysis is independent of property and market specific characteristics, such as business volume and property size. So, while horizontal analysis is a dynamic way of looking at data, vertical analysis deals with the static details.
The formula to perform a vertical analysis is simply a percentage calculation. Let’s note the measure of interest as X, and the base measure as Y. Then:
An important consideration when applying this formula is that both measures (X and Y) must be from the same period. For example, you could find labor expenses for the current financial year as a percentage of total revenue for the current financial year. However, it would make no sense to find labor expenses for the current financial year as a percentage of total revenue for December this year. This comparability check is critical to achieve meaningful results.
Generally, the chosen bases are Total or Departmental Revenue, because managers want to understand their properties’ revenue mix and expenses flow through. As a standard, when looking at an operating statement, a department’s revenue is the base for its own expenses, and Total Revenue is the base for each department’s revenue, undistributed operating expenses and GOP. However, you can customize your analysis using any measures that you find relevant to the specific question you want to answer.
As in our previous post, we will use an example to clarify what has been defined until now:
You are the CFO of the Illustration Hotel, and after performing a horizontal analysis on your P&L statement for the year 2018, you understand how the volume of your business has evolved from 2017. Now, you would like to have another perspective on the property’s performance, and so you turn to vertical analysis to see where your revenue is coming from and how efficient you are at turning it into profit.
Again, you first look at the Rooms Department. In 2018, the hotel recorded $12,088,510 in this measure, while Total Operating Revenue for that same year was $18,118,540. How much does the Rooms department revenue contribute to the total?

Therefore, 66.7% of the total revenue recorded for the Illustration Hotel in 2018 was generated by the Rooms Department. Table 1 summarizes the revenue mix for the hotel:
Table 1. Revenue Mix – Vertical Analysis
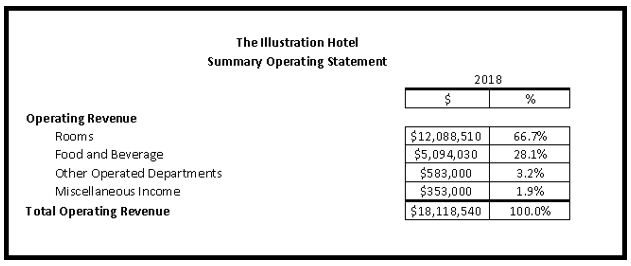
Note that Total Operating Revenue is the base for all the departmental revenues, and that is why it equals 100%. It is clear that for the Illustration Hotel Rooms is the dominant revenue generator, followed at a distance by F&B.
Moving further down the operating statement, you want to see how much of each department’s revenue goes to paying for its own expenses. The Rooms department recorded $3,630,897 of departmental expenses. How much did it take away from the department’s revenue?
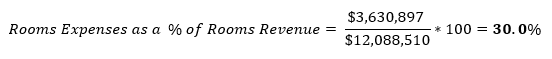
So, in 2018 30% of the revenue generated by the Rooms Department was used to pay for its own expenses. Table 2 shows the results for the rest of the departments and the total:
Table 2. Departmental Expenses as a % of Departmental Revenue – Vertical Analysis
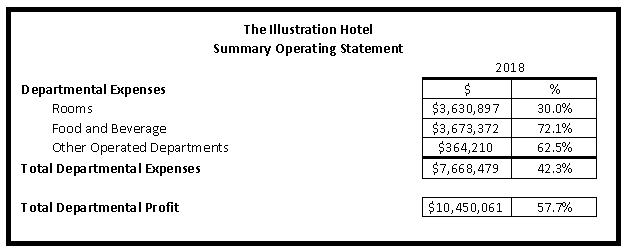
It is important to point out that there are no expenses associated with Miscellaneous Income because it mostly comprises cancellation fees, interest income and net income derived from concessions operated by third parties. Also, Total Departmental Expenses is not 100% because it was not the base of the analysis. Instead, we divided it by Total Operating Revenue to calculate its percentage.
The cases of F&B and Other Operated Departments are striking, since they had to use over half of the revenue they generated to pay for their own departments’ expenses. All in all, out of the total revenue the Illustration Hotel generated, 42.3% was used to pay for the total departmental expenses, while the remaining 57.7% was left as total departmental profit.
Finally, you turn to the Undistributed Operating Expenses. If Administrative & General Expenses for 2018 were $2,305,490, what percentage of Total Operating Revenue did they take up?

In Table 3 you will find the results for all Undistributed Operating Expenses schedules and the Gross Operating Profit.
Table 3. Undistributed Operating Expenses as a & of Total Operating Revenue – Vertical Analysis
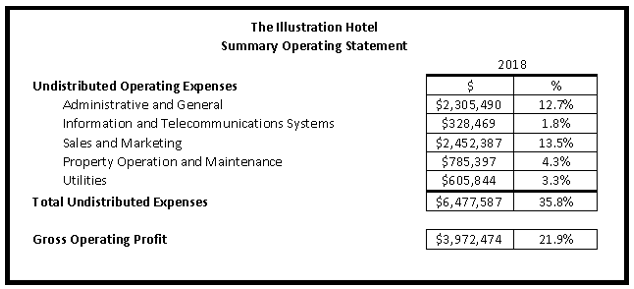
Sales and Marketing, and Administrative and General account for most of Undistributed Operating Expenses. In the end, the Illustration Hotel has only 21.9% of its revenue left as GOP.
What can you do with this information? First, you have a very good idea of how revenue enters and leaves your operation. This is very important when preparing a budget and setting targets for future performance. Also, running this analysis on a regular basis helps you understand whether you are on track towards achieving your financial goals, or if you need to implement changes in the operation to correct course. But also, you can use this information to compare your property to your competitive set to gain insights that lead you to best practices. Table 4 shows the vertical analysis of the Illustration Hotel versus its competitive set:
Table 4. Vertical Analysis, The Illustration Hotel and Competitive Set Average
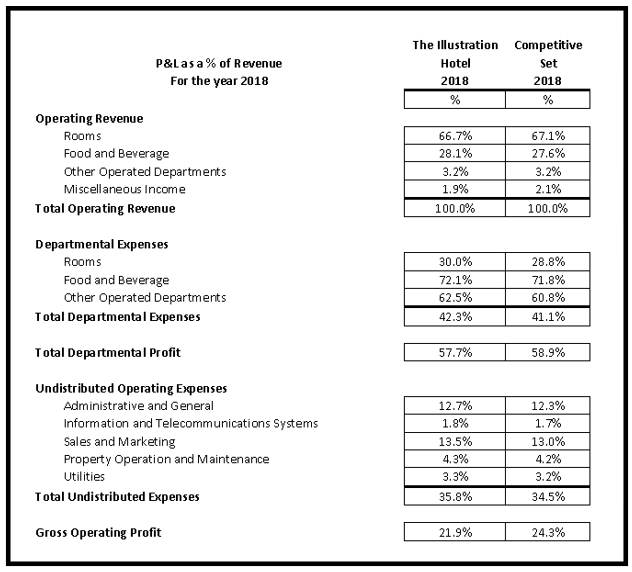
From the Operating Revenue point of view, the Illustration Hotel’s mix has a higher contribution from the F&B department than its competitors, and a lower Rooms and Miscellaneous Income participation. This could mean that you are outperforming your competitors in generating F&B revenue, which would be a cause for celebration. However, it could also mean that for some reason you are lagging behind on Rooms revenue and that’s why your F&B department has a higher share of total revenue, which would be a warning sign.
On Departmental Expenses, the Illustration Hotel is always above the competitive set. This could be a sign of inefficiency, but it could also point towards higher service standards and customer experience. For example, are F&B expenses as a percentage of F&B revenue higher because your operation is more wasteful, or because you use better quality ingredients?
When looking at Undistributed Operating Expenses, Administrative & General and Sales & Marketing show the largest difference. Maybe you are paying higher credit card commissions, and that is at the root of the higher Administrative & General percentage. Perhaps you have a costly loyalty program in place, or you have launched a new media campaign that is diverting more resources into your Sales & Marketing department.
Bottomline, the Illustration Hotel is not as profitable as its competitive set, but there are many different reasons that could explain this. As with horizontal analysis, vertical analysis is a guide towards relevant strategic questions about your operation, and you should dig further into the data to find the story that makes the most sense.