



 HotStats Blog
Every budget season carries an implicit question: does the region's cost story look like the market you already know, or does it need its own reading?
For APAC in 2027, the honest answer is the latter. The aggregate picture is healthy — margins are expanding, revenue is comfortably outrunning costs — but the mechanics underneath are distinctly APAC's own.
There is no large-base cost line running hot on a regional basis, payroll doesn't concentrate at the top of the market the way it does elsewhere, and the region's growth is being carried by a handful of markets moving at a very different speed than the rest.
The Headline: Cost Discipline Holds, Nothing Large Is Running Hot
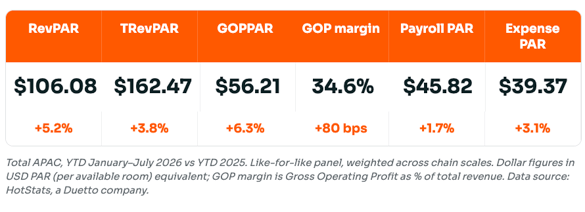
Total APAC TRevPAR grew 3.8% YTD through July, and GOPPAR grew nearly double that at 6.3% — margin expansion driven mostly by revenue outpacing cost growth rather than active cost-cutting.
.png?width=2400&height=1860&name=HotStats%20APAC%20Cost%20Lines%20Chart%20(2).png)
Unlike the pattern seen elsewhere, no large-base payroll or expense line in APAC is running ahead of revenue growth. Rooms payroll and S&M payroll are both tracking exactly in line with TRevPAR growth; F&B payroll, utilities and A&G payroll are all running meaningfully behind it. I wouldn't lose sleep over a 9.8% move on a $1.60 PAR, but I'd still give it its own line in the 2027 budget rather than folding it into a blended IT/A&G number, purely so it doesn't get lost if it starts compounding on a bigger base next year.
Payroll Concentration Doesn’t Repeat the Top-Of-Market Story
Payroll as a share of revenue in APAC sits in a tight band across chain scales — roughly 23% to 30% — with no tier standing meaningfully apart from the rest.
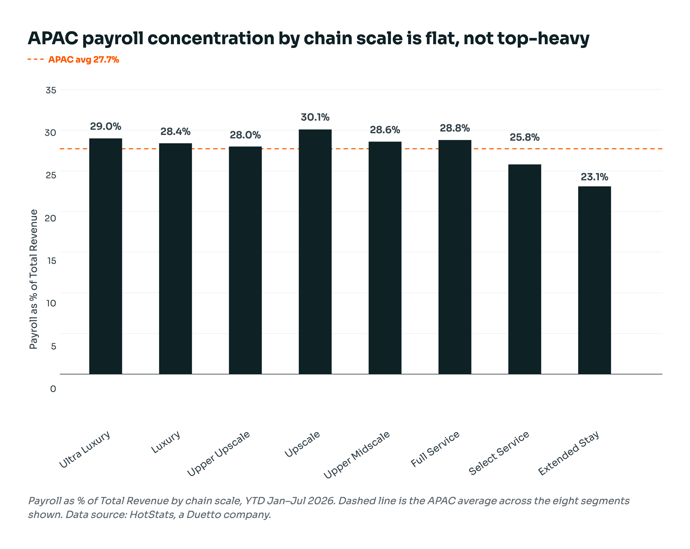
Extended Stay and Select Service actually carry the lowest payroll ratios in the region, and Upscale carries the highest, at 30.1%. There is no Luxury-tier payroll concentration risk to flag here the way there is in other regions; APAC's labor cost structure is comparatively even across the segment, which changes what “stress-test payroll” should mean for a 2027 APAC budget — it's less about one tier absorbing disproportionate wage pressure, and more about tracking each tier's own trend.
Markets Are Splitting Into Clear Tiers of Momentum
The regional aggregate masks a wide spread of individual market performance. Vietnam, Korea, Hong Kong and Taiwan are running well ahead of the pack on both revenue and profit growth, with Sri Lanka close behind on the strength of its World Cup-boosted year; Malaysia is the region's clear outlier, contracting on every headline metric; and a broad middle group — Japan, Singapore, Thailand, Australia, Indonesia and the Philippines — is growing steadily with revenue and cost lines closely matched..png?width=690&height=469&name=HotStats%20APAC%20Markets%20Growth%20Chart%20(1).png)
Three Markets Are Worth Calling Out by Name for 2027 Planning
1. Vietnam and Korea
Vietnam and Korea are the region's growth engines — GOPPAR up 30.2% and 27.9% respectively, both comfortably outrunning their own cost growth. Hong Kong (+19.8% GOPPAR) and Taiwan (+14.3% GOPPAR, USD-converted) are close behind. The scale of these moves (double-digit to 20%+ revenue growth) is large enough that 2027 budgets should ask whether this is durable repricing or a lower-base effect before extrapolating any of them forward.
2. Malaysia
Malaysia is this cycle's outlier — RevPAR, TRevPAR and GOPPAR all declined YTD (–1.4%, –2.0% and –4.6%), and GOP margin contracted 80 basis points. Unlike a demand-collapse story, expense PAR is also down (–4.0%) while payroll PAR is still rising (+2.2%) — the same pattern flagged as a caution elsewhere: falling expenses alongside rising payroll usually means variable cost-cutting in the face of softer volume, not a genuine efficiency gain. Malaysia should be budgeted as its own case, not folded into the regional average.
3. Japan
Japan is the region's most balanced market — revenue, payroll and expense growth are all clustered within a point of each other (3.1%, 2.3% and 2.7%), the tightest match of any market in the dataset. That makes it the most “read the trend forward” market in the region for 2027 purposes.
.png?width=690&height=516&name=HotStats%20APAC%20GOPPAR%20Growth%20Chart%20(1).png)
.png?width=690&height=626&name=HotStats%20APAC%20Market%20Summary%20Table%20(1).png)
The T20 World Cup: a real lift in one host market, not the other
The ICC Men's T20 World Cup ran across India and Sri Lanka from 7 February to 8 March 2026, giving APAC its own version of a mega-event demand test. With full-year data now available for both co-hosts, the comparison is cleaner than a single-window read: Sri Lanka's RevPAR grew 14.9% YTD for the full year, and grew even faster — 18.8% — during the tournament window itself, a real incremental step-up of roughly 4 points above its own already-strong run-rate. India's pattern is the opposite: RevPAR grew 7.2% YTD for the full year, but only 3.5% during the Feb–March event window — actually trailing its own run-rate, not adding to it.
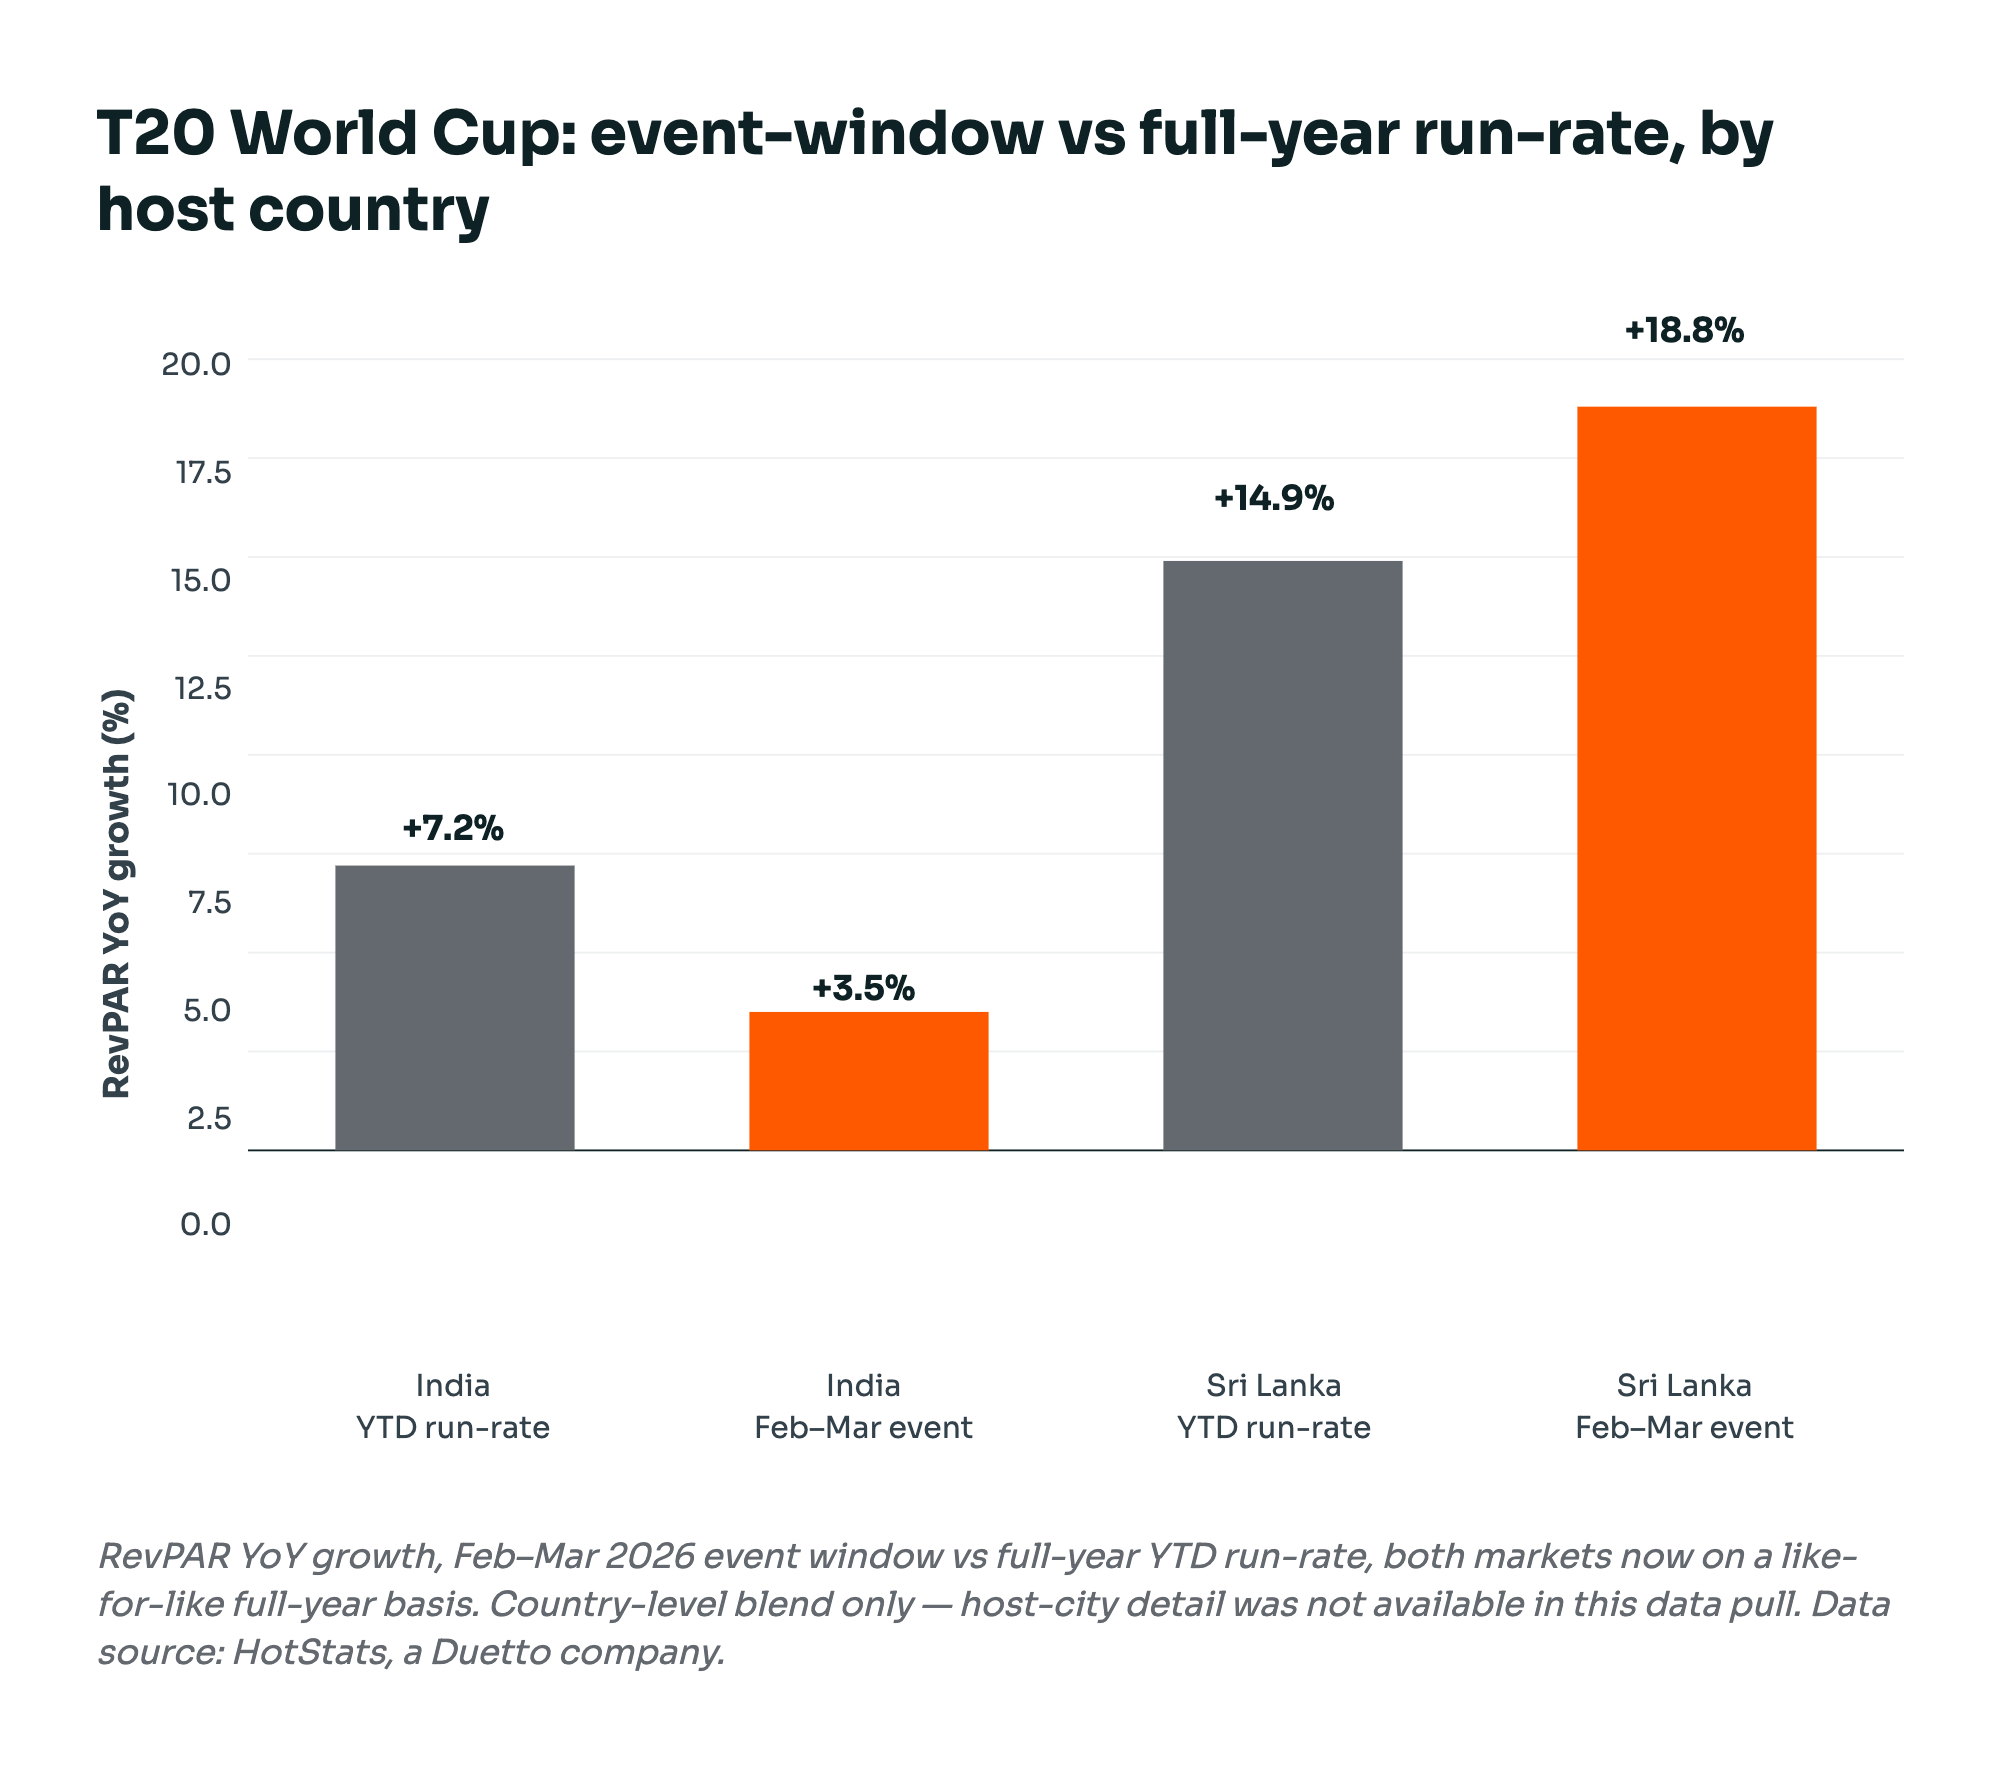
That is a genuinely useful, and now well-supported, finding: Sri Lanka shows a real, measurable event lift on top of its trend, consistent with a smaller co-host where the tournament represents a large share of total visitation. India shows no incremental lift at all at the national level — most likely because the tournament's five Indian venues are a small share of a very large national panel, and any host-city-level spike is being diluted into the country-wide blend rather than erased. For 2027 budgeting, this argues for the same discipline the Americas World Cup analysis used — treat Sri Lanka's February–March performance as a real, temporary event-driven spike rather than a new baseline, and don't assume a national-level event bump for India at all; if one exists, it lives in host-city data this pull doesn't have.
Testing the Hot-City Hypothesis: Ahmedabad Is the Real Story
City-level data for three of India's five World Cup venues — Ahmedabad, Mumbai and New Delhi — confirms the hypothesis, and more sharply than expected. Each city's file carries both a full-year YTD figure and an isolated Feb–March event-window figure, which makes this the cleanest event-attribution read anywhere in this dataset. Ahmedabad, home to the 132,000-seat Narendra Modi Stadium in a comparatively small hotel market, grew RevPAR 11.9% for the full year — but 25.5% during the Feb–March tournament window itself, more than double its own run-rate. Mumbai and New Delhi show essentially no incremental lift at all: Mumbai's event-window growth (8.0%) is flat against its 8.3% YTD run-rate, and New Delhi's event-window growth (6.9%) actually trails its 9.2% YTD run-rate.
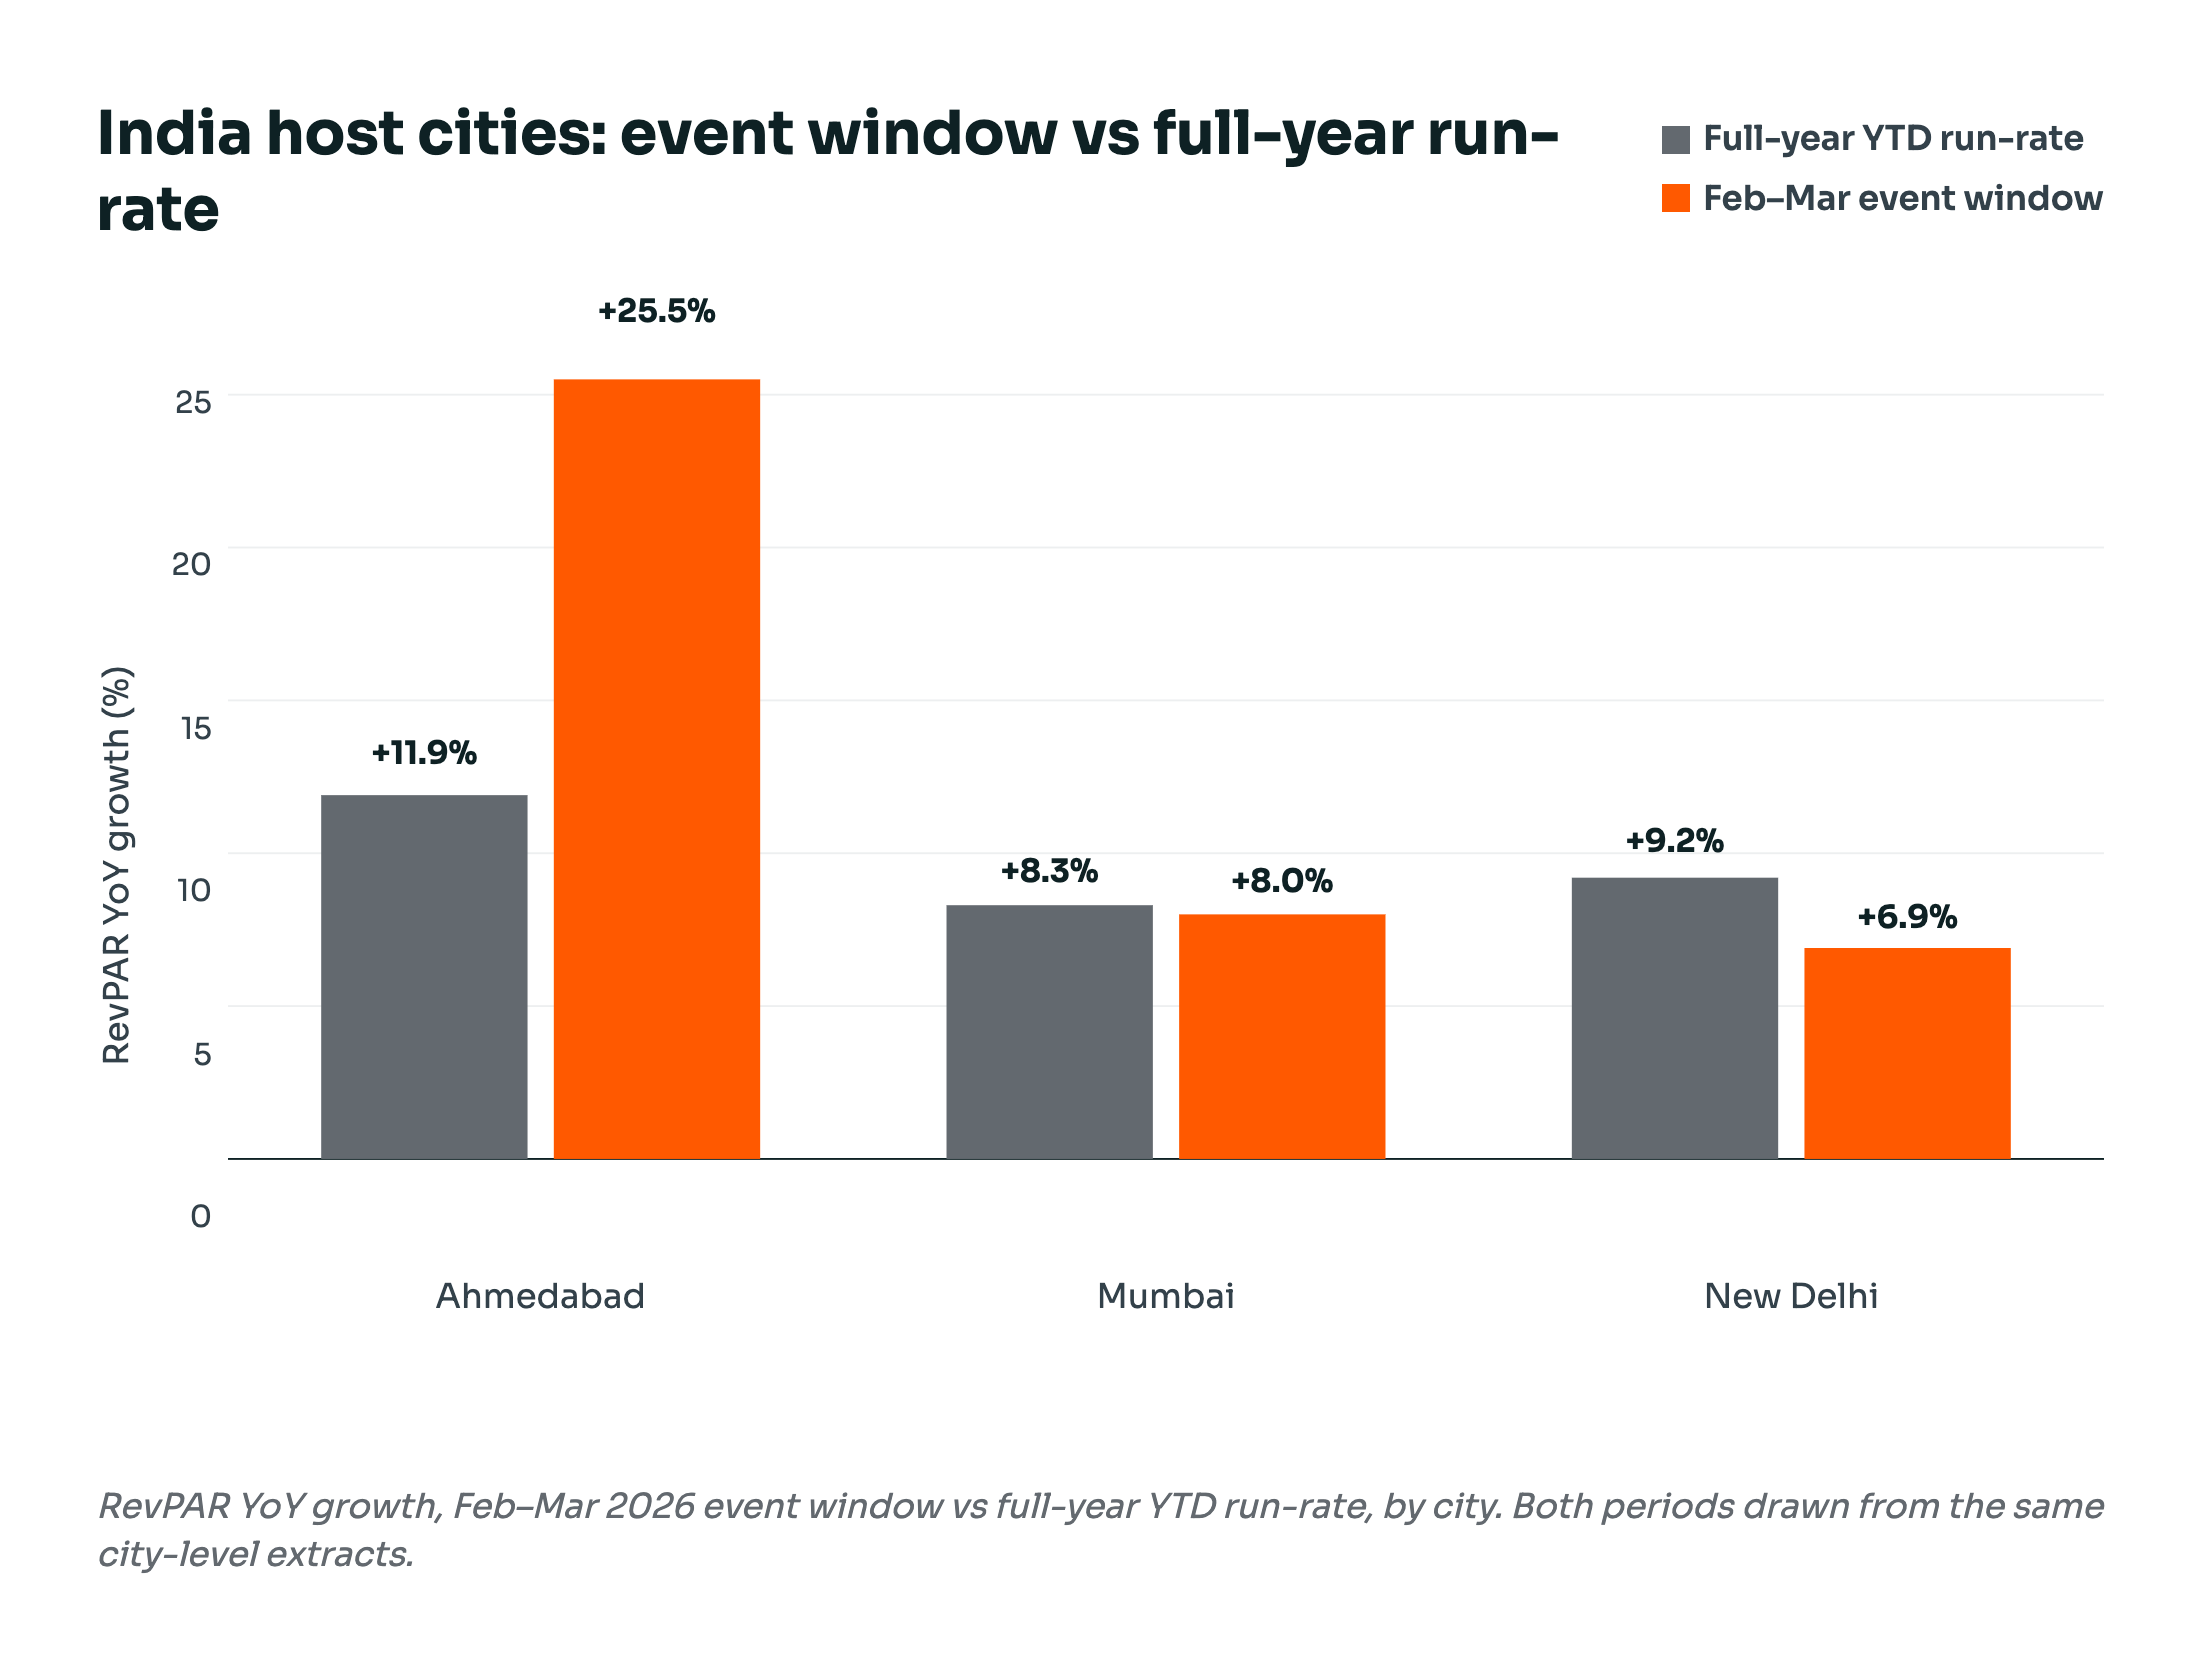
This resolves the question raised earlier: the national-level India numbers showed no World Cup lift because Ahmedabad's genuine, large event-driven spike is being diluted into a blend with Mumbai and Delhi — both of which absorbed their matches without a visible bump, consistent with hosting a single group-stage fixture inside a much deeper hotel market. Ahmedabad's profit conversion also looks different in the event window than it did across the full year: GOPPAR grew 23.4% during Feb–March, in line with its revenue growth, versus only 6.1% for the full year — meaning the margin drag identified earlier is concentrated in the other ten months, not the tournament window itself.
For 2027 purposes, Ahmedabad should be modeled as a genuine, city-specific event market; Mumbai and Delhi should not be assumed to carry any World Cup-specific uplift at all.
This demonstrates the immense power of diving beneath surface-level metrics to uncover standout growth opportunities. While aggregate regional trends offer a solid baseline, zooming into specific city data reveals high-performing gems like Ahmedabad, proving how localized insights can unlock compelling strategic advantages for future planning.
What This Means for the 2027 Conversation
1. Don't import assumed cost pressure the data doesn't show. No large-base APAC cost line is currently outpacing revenue growth — budgets built on an assumed payroll or expense squeeze should be checked against this before being finalized.
2. Payroll risk in APAC isn't concentrated at the top of the market. Model each chain scale on its own trend rather than assuming a Luxury-tier wage-inflation risk; the data doesn't support singling out one tier the way other regions might.
3. Budget Vietnam, Korea and Hong Kong as their own conversation. Growth at this scale (20–30% on key lines) needs an explicit view on durability before it's extrapolated into a 2027 run-rate.
4. Don't budget Malaysia off this year's expense line. Falling expense PAR alongside rising payroll PAR points to variable cost-cutting against softer demand, not a sustainable efficiency gain — the same caution flagged for demand-collapse markets elsewhere.
5. Treat the T20 World Cup as real, but concentrated in one city. Sri Lanka shows a genuine ~4-point national event lift; India shows none nationally — but that blend hides Ahmedabad's real, isolated event-window spike (RevPAR +25.5% vs an already-strong +11.9% full-year run-rate). Mumbai and New Delhi show no incremental lift at all. Budget Ahmedabad as its own event-driven market for the 2027 conversation; don't extend any tournament assumption to Mumbai, Delhi, or India as a whole.
What I’d Tell Owners Heading Into 2027
The aggregate APAC number is genuinely healthy, and unlike Americas or EMEA, there's no single large cost line or payroll tier I'd tell you to lose sleep over regionally. But “no regional red flag” isn't the same as “nothing to watch”. The risk here isn't a cost line, it's extrapolation.
Vietnam, Korea and Hong Kong are growing fast enough that the real question for 2027 isn't whether the growth is real, it's whether it repeats. And Ahmedabad is the sharpest reminder in this entire budget season series that a clean national or regional average can fully hide a real, local story.
My read heading into 2027: budget the steady middle — Japan, Singapore, Thailand, Australia, Indonesia, the Philippines — off the trend as shown. Budget the growth engines and Malaysia as their own conversations, each with an explicit durability or recovery assumption stated out loud. And before ruling out an event effect anywhere else in the region, ask whether the city-level data actually exists to see it — Ahmedabad only became visible because someone looked one level down.
The region looks calm at the aggregate level. It isn't, it's just better at hiding where the movement is.