HotStats Blog
It’s U.S. Open week. The top golfers in the world convene just outside New York City at Winged Foot Golf Club (no fans allowed) where they will compete for a major title and all the prestige and money that comes with it.
Unlike some other golf tournaments, the U.S. Open is historically the most difficult. The rough is thicker. The greens are slicker. The stakes are higher. And the winning score—frequently above par—reflects that.
The U.S. Open is a grind. The flashier, familiar, famous player is not assured victory. Case in point, last year’s victor, Gary Woodland, was ranked 25th in the world when he won and, unlike one Tiger Woods, can still walk down a street anonymously. The evidence is clear: Slow and steady wins this four-day, high-pressured sporting even.
In the hotel industry, extended-stay hotels are the grinders. They aren’t flamboyant; they don’t hit 350-yard drives (which would be weird anyway since they are inanimate objects, but you get the point.) No matter what is thrown at them, they still perform admirably.
There’s data to back that up.
For the purposes of this research, we looked at the U.S. and the three ensuing months after the bottom dropped out in the hotel industry beginning in March due to the coronavirus.
Occupancy Check-Up
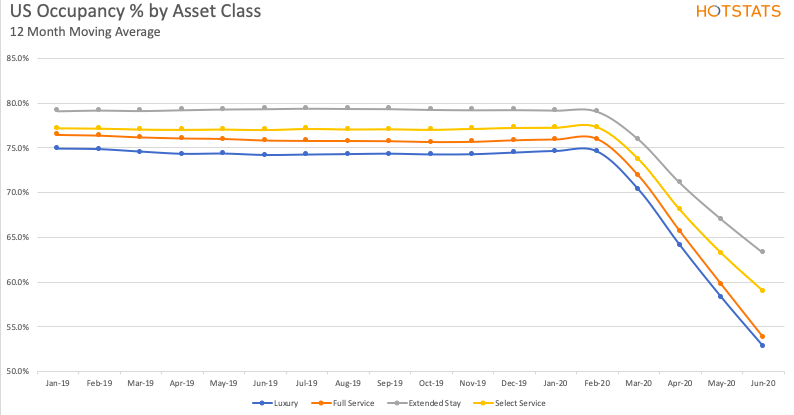
First, some context. Extended-stay and select-service properties have historically recorded higher occupancies than full-service and luxury properties, a trend that jibes with our recent break-even analyses—here and here.
The 12-month-moving average occupancy rate for extended-stay was recorded at 76% in March 2020, 2.2 percentage points higher than select-service and 4.1 percentage points higher than full-service.
If March was when everything started to turn sour, April was two handfuls of Sour Patch Kids and SweeTARTS eaten at once. According to HotStats data, actual occupancy for both luxury and full-service properties dropped to below 30% in March, before turning drastically worse in April, to 3.2% and 5.1%, respectively. They approved slightly in May and June, getting above double digits.
Meanwhile, select-service and extended-stay hotels fared better. The former recorded a 36.9% occupancy rate in March, dropped to 12.7% in April, but improved gradually in the next two months, ending June at 33.5%. But it’s extended-stay that bested all other asset classes by a rather wide margin. Total occupancy for extended stay in March hovered around 44% and while the other asset classes foundered wildly in the subsequent three months, extended-stay—though certainly not fully immune from the coronavirus grip—held far better. Occupancy in April was 23.9%, a full 20 percentage points higher than the luxury segment, which illustrates the disparity in the way travel demand was impacted due to the pandemic. Occupancy for the extended-stay hotels improved month to month, recording a rate of 32.4% and 41.5% in May and June, respectively.
Why, then, does extended-stay fare better than other asset classes during difficult times? There’s no definitive answer, but certain attributes do appear to follow the extended-stay segment that allow it an expanse of unimpeded demand that is not shared by other asset classes. Extended-stay properties are built for just that: longer stays, which bring with them certain amenities that other asset classes don’t offer, such as full kitchens. Services like that beckon groups such as construction crews and other contractors on longer projects, people and families between jobs or those that are relocating for a new job. Some extended-stay hotels, due to the circumstances, host medical workers and others with unfortunate circumstances, such as those who have lost jobs or, in some cases, the homeless.
On Revenue
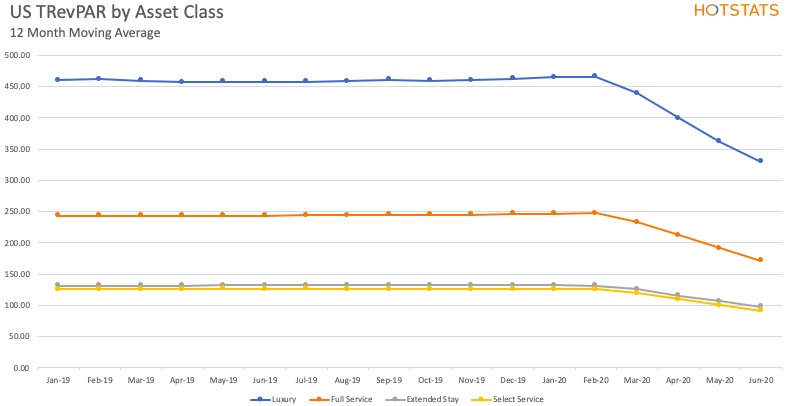
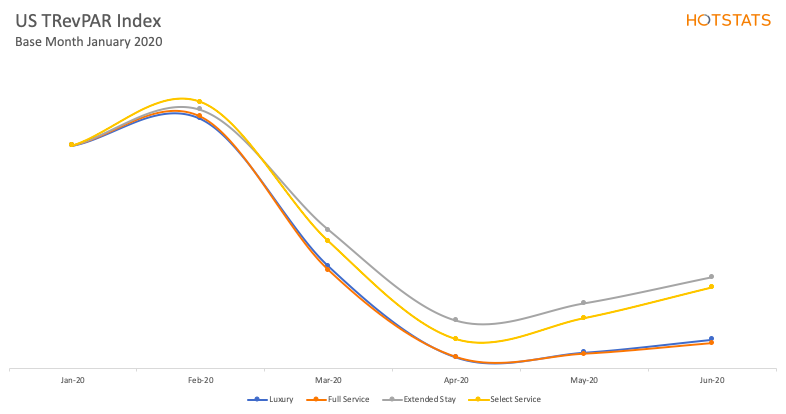
From a total revenue perspective, much of the trends stay true. Naturally, luxury and full-service hotels garner higher TRevPAR by the nature of their business. But when the pandemic struck, it fell hard and fast for those two asset classes.
Luxury TRevPAR typically runs well over $400, but in March dropped to just under $207, then cratered to $21.74 in April. By June it was up to $57.75. Full-service dropped some $152 per available room from February to March, and was down to $10.58 in April. These two asset classes play—under normal times—to corporate transient and group travel, which all but disappeared in the wake of COVID-19 and has yet to return. In the case of luxury, many of these hotels are located in downtown urban markets, some of which remain literal ghost towns, void of office workers and travelers wary of their health. The combination has led to precipitous revenue losses for these two segments.
Extended-stay decreased, too, but the swing wasn’t as large. Of all the asset classes, extended-stay recorded the highest TRevPAR in April at $26.56, almost $5 more than luxury and $6 higher than select-service. The same pattern held in May and it wasn’t until June that luxury bested extended stay in TRevPAR. Meanwhile, it’s been the full-service that has suffered the most in TRevPAR, a combination of deflated demand and a cut off of revenue from the likes of food and beverage and other ancillary revenue that come with operating a full-service hotels.
The Bottom Line
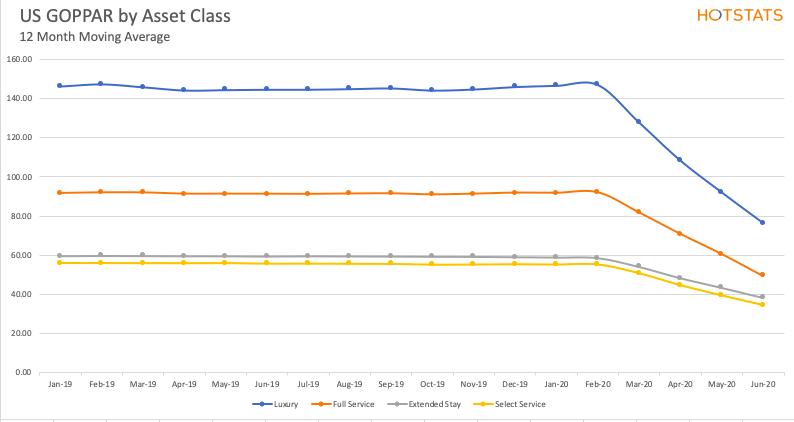
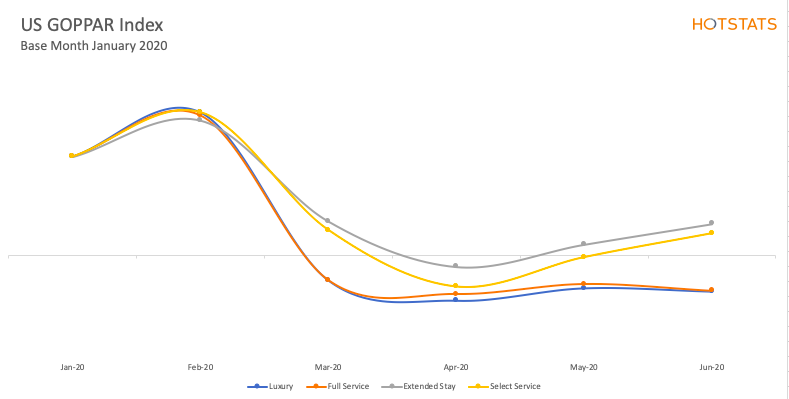
Likewise, profitability held similar trends among asset classes. Though gross operating profit per available room (GOPPAR) fell into negative territory in April for all asset classes, extended-stay fared the best, which is to say the least worse. Extended-stay GOPPAR in April was $-4.23 compared to $-54.92 for luxury and was more than $6 better than select-service. Further, extended-stay was the first segment to reach positive GOPPAR, when it recorded a GOPPAR of $4.32 in May. In June, luxury and full-service GOPPAR remained negative as extended-stay stayed positive ($12.24) and was joined in the black by select-service ($7.91).
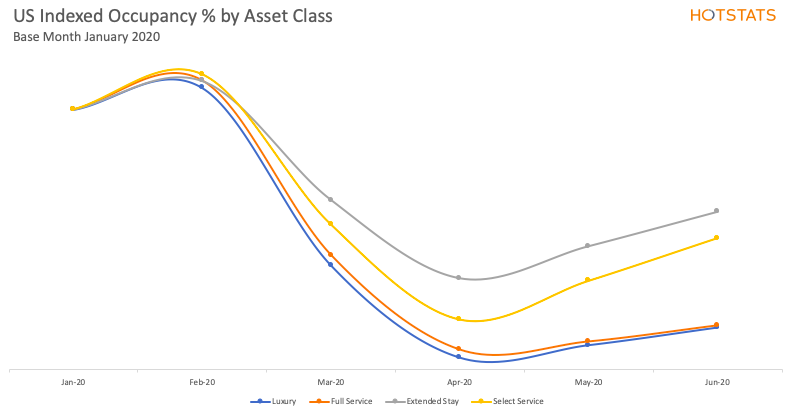
Beyond the actuals, the indexed graphs show the speed of recovery for each KPI within each asset class. These graphs show January 2020 as the base month (100%) for occupancy, TRevPAR and GOPPAR, and the lines show how each of these KPIs fared each month compared to that base. For the total U.S., it’s clear that extended-stay and select-service properties are trending up at a much faster pace than full-service and luxury properties across all three KPIs. This is evident in even severely hit markets such as California, Texas, Florida and Arizona).
The extended-stay segment is the work horse of the hospitality industry. It’s understated, gets the job done and never complains. The data show that the performance of the asset class is steadier than other segments, most importantly where it counts—the bottom line.