HotStats Blog
It feels interminable now, but there will come a day when the coronavirus — this “invisible enemy” that continues to lay waste to normal, everyday functions and in a matter of weeks succeeded in leveling the world’s economy — will subside and end.
Though recovering occupancy and generating revenue will be at the top of hoteliers’ lists, beyond that, understanding how to turn revenue into profit will be essential to sustaining growth post-COVID-19.
One way to do that is to understand the concepts of flow-through and flex. Historically, hotel performance has been measured using three main metrics: occupancy rate, average daily rate (ADR) and revenue per available room (RevPAR).
Though these are useful metrics, they only help to explain one portion of the story: room-generated revenue. That’s like citing the circulatory system as the only reason the human body functions. Yes, moving blood and oxygen around the body is vital to survival, but you also need the nervous system, the digestive system and other systems to sustain life.

If running a hotel was a biological system, the Rooms department would certainly be an important system; but so too would the systems that accounted for Food & Beverage, Conference & Banqueting, Spa, Property & Maintenance, Sales & Marketing— see where I’m going with this?
There are many functions that go into running a hotel, and they all — the hope is — lead to one thing: profitability. Working off of our biological metaphor again (and forgive the scatological imagery), think of profitability as the end result of the digestive tract.
A hotel takes in revenue, but those dollars aren’t pure profit. They are used to pay salaries, pay suppliers, pay utilities, service debt — a phalanx of expenses. Only when those are all covered does what’s left over count as profit.
Revenue winds its way through, and a bit here and a bit there is siphoned off at each stop until all entities are satisfied.
In the hotel industry, this serpentine process is known as either flow-through, or flex, depending. And though both measure how much made it through a business from one period to another, each has its own unique definition.
Flow-through, on the one hand, is defined as the percentage of incremental profit that flows to the bottom line from each incremental dollar of top-line revenue when there is a revenue surplus relative to budget or previous year. Flex, meanwhile, carries a similar definition; the distinction being that it is the amount of profit that is flexed (or saved) when there is a revenue shortfall.
In the face of COVID-19, hoteliers now regrettably find themselves in a flex position, and it could stay that way for the near-to-long term until revenue bounces back. When demand does begin to trickle back, it will be incumbent upon hoteliers to do all they can to generate profitability amid a revenue shortfall — and this means keeping expenses at bay as best they can.
Calculating Flow-Through and Flex
Here’s the formula and interpretation of flow-through and flex:
Flow-Through
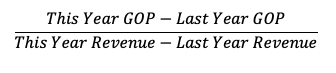
There are two types of flow-through: positive (when both revenue and GOP are positive) and negative (when revenue is positive, but GOP is negative).
Positive Flow-Through
| This Year | Last Year | Variance | |
| Revenue | $150,000 | $130,000 | $20,000 |
| GOP | $60,000 | $50,000 | $10,000 |
From the above example, we can see that the flow-through percentage is $10,000/$20,000 = 50%. That means that 50% of the additional revenue can be converted into profit when revenue is increasing for that year.
Negative Flow-Through
| This Year | Last Year | Variance | |
| Revenue | $150,000 | $130,000 | $20,000 |
| GOP | $60,000 | $65,000 | ($5,000) |
The flow percentage in this scenario is ($5,000)/$20,000 = -25%. In this case, the revenue is increasing, but profitability is in negative territory. Unless other factors are present, the cost-control ability in this year shows potential for improvement.
Determining an acceptable flow-through range is a complex procedure, but the industry standard is typically in the 50%-60% range. In most cases, the higher the percentage in flow-through status, the better. However, the real determination for the hotel’s financial management depends on a deeper comparison of the historical data as well as other influential factors.
Flex
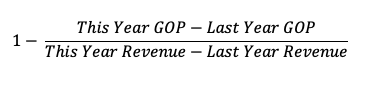
As it is for flow-through, there are two types of flex: positive (when revenue is negative, but GOP is positive) and negative (when both revenue and GOP are negative).
Positive Flex
| This Year | Last Year | Variance | |
| Revenue | $150,000 | $180,000 | ($30,000) |
| GOP | $60,000 | $50,000 | $10,000 |
In this case, flex percentage can be calculated as 1-[$10,000/($30,000)] = 133%. Although the hotel is losing revenue year-over-year, profit is still growing, possibly because of cost-control strategies.
Negative Flex
| This Year | Last Year | Variance | |
| Revenue | $160,000 | $180,000 | ($20,000) |
| GOP | $50,000 | $80,000 | ($30,000) |
The above is an example of a negative flex status. The flex percentage in this instance is 1-[($30,000)/($20,000)] = -50%. Since both revenue and GOP were down year-over-year, there was negative flex, because the drop in GOP was greater than the drop in revenue.
In the hotel industry, standard flex range is typically 30%-35%. The reason the flex percentage is lower is that it is more challenging to save money on a property when you are short of revenue. This is typically because of fixed expenses that are static or do not change even when the hotel is underperforming.
Beyond calculating flow-through and flex based on total hotel revenue and total hotel GOP, it is also instructive to understand and measure both by department in order to home in on where the positive or negative story is within a hotel’s operation.
In our example equations, we use this year and last year, but any available time period can be used — month, quarter, year-to-date, rolling-12-month or any other custom-selected period.
Utilizing historical accounting data from any specific property can help you benchmark your profitability and financial management capacity. Moreover, you can factor in different elements such as renovations, property improvement projects or special property events to analyze financial health status.
Concluding Thought
Though the notions of flow-through and flex are understandably not top of mind for hoteliers during these extraordinary times, when the world begins to right itself and travel ensues, measuring how much revenue is converted to profit over a select period will be of paramount importance to regaining a grasp of your business and gauging its operational performance.
It’s a strange new world for the hotel industry, one fraught with uncertainty and fear — the likes of which have never been seen before. The global consumer and, by extension, the global traveler, have short memories, and when it’s safe to go outside again, the expectation is that travel will come back; it will just take time.
Savvy hoteliers will get ahead of the game and understand that market data and market context should be leaned on and will lead to smart decision-making.
Because this, too, shall flow through.